

Forecasting San Francisco Region Home Median Values (Part 1)
Photo by Business Insider
Programming Language: R
Project Goal
This report provides a forecasting analysis of the San Francisco Region Home Median Values time series data, using various forecasting methods. The programming tools used to perform preliminary data analysis, choosing and fitting of models, then finally using and evaluating of forecast models include Microsoft Excel, Exponential Smoothing Macro (ESM) and R.
Our objective for this project is to:
- Explore the real quantitative impacts of significant economic crisis, the Dotcom Bubble and the bursting of the Housing Bubble, on San Francisco Home Median Values.
- Find the best forecasting model that predicts the future as accurately as possible, given all the information that is available.
Forecasting Methods
The report will present several forecasting model such as
- Autoregressive Model (AR)
- Multi-regression Model
- Autoregressive Model (AR) with Economic Indicators Model
- Damped Additive Trend Exponential Smoothing
- Corrected Additive Smoothing Exponential with Holt Method Model
- ARIMA Model
Data Source
The original file dataset is called “City_Zhvi_TopTier.csv”. This dataset contains records of the top tier home median values in the US by city from 1996 to 2018. The original dataset consists of 13,491 observations 275 different fields. It contains the information about a Region id, a Region name, a State, a Metro, a county name, a size rank, and the year 1996-04 to 2018-08.Source
Exploratory Analyses
1. Economic Crises in San Francisco
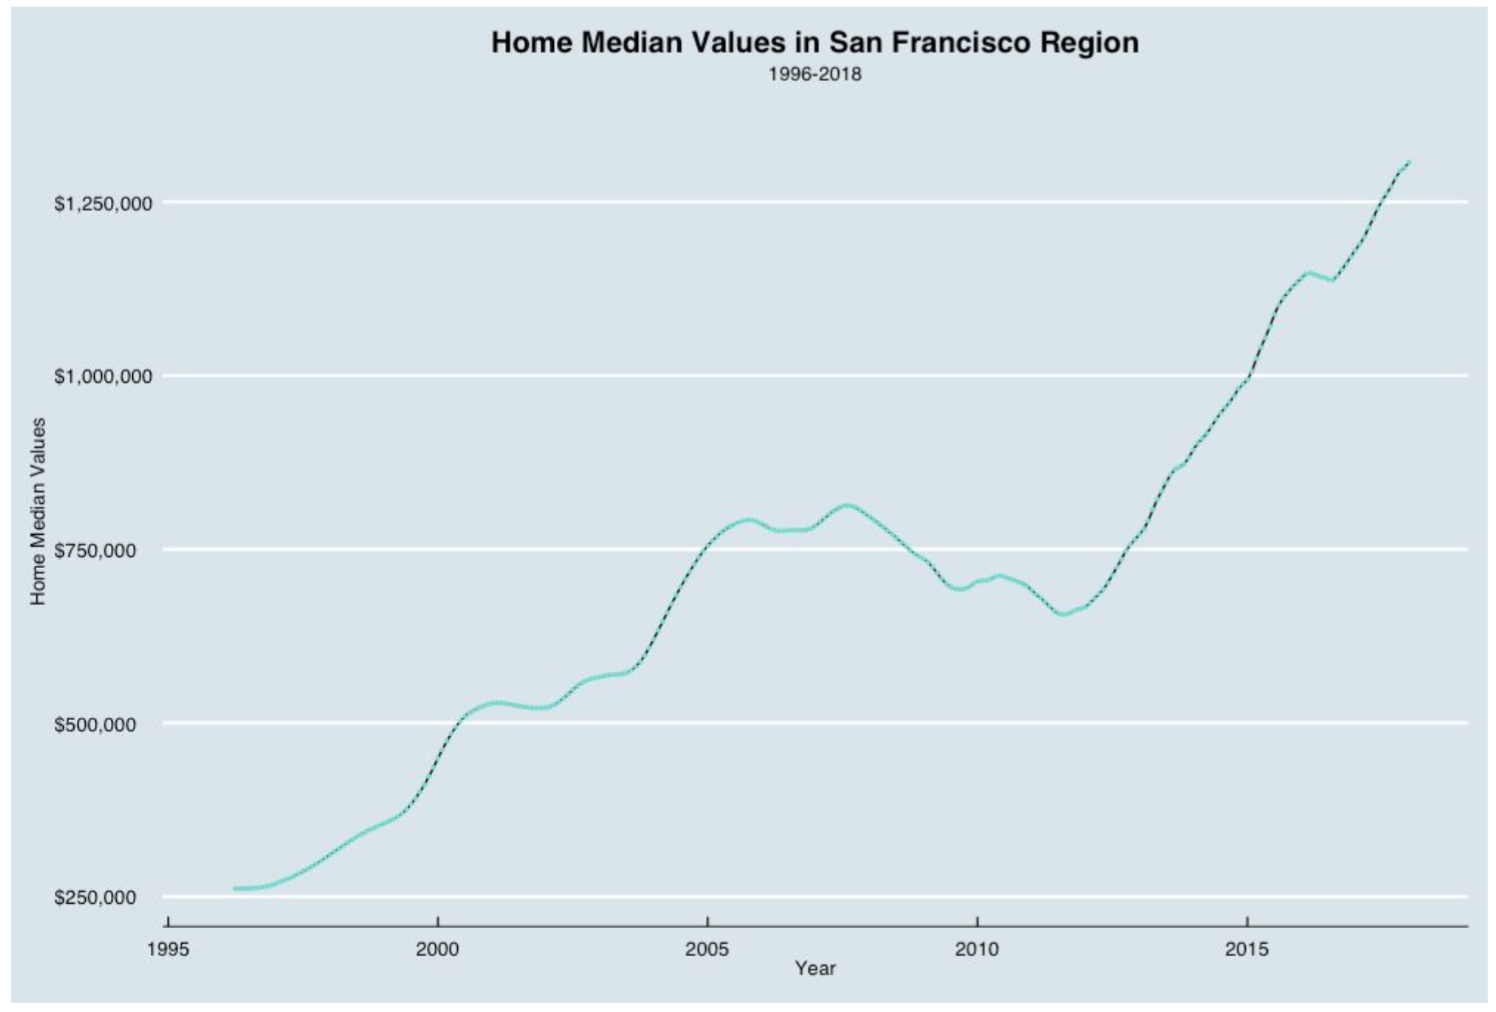
From the graph below, we can see an increasing trend with no seasonal component from 1995 to 2018. In 2012, the plot shows that home median values begin to appreciate, post the financial market crash in 2008. The economy starts improving, interest rates are low, and a rising buyer demand is paired with a low supply of home listings, bringing home median values up.
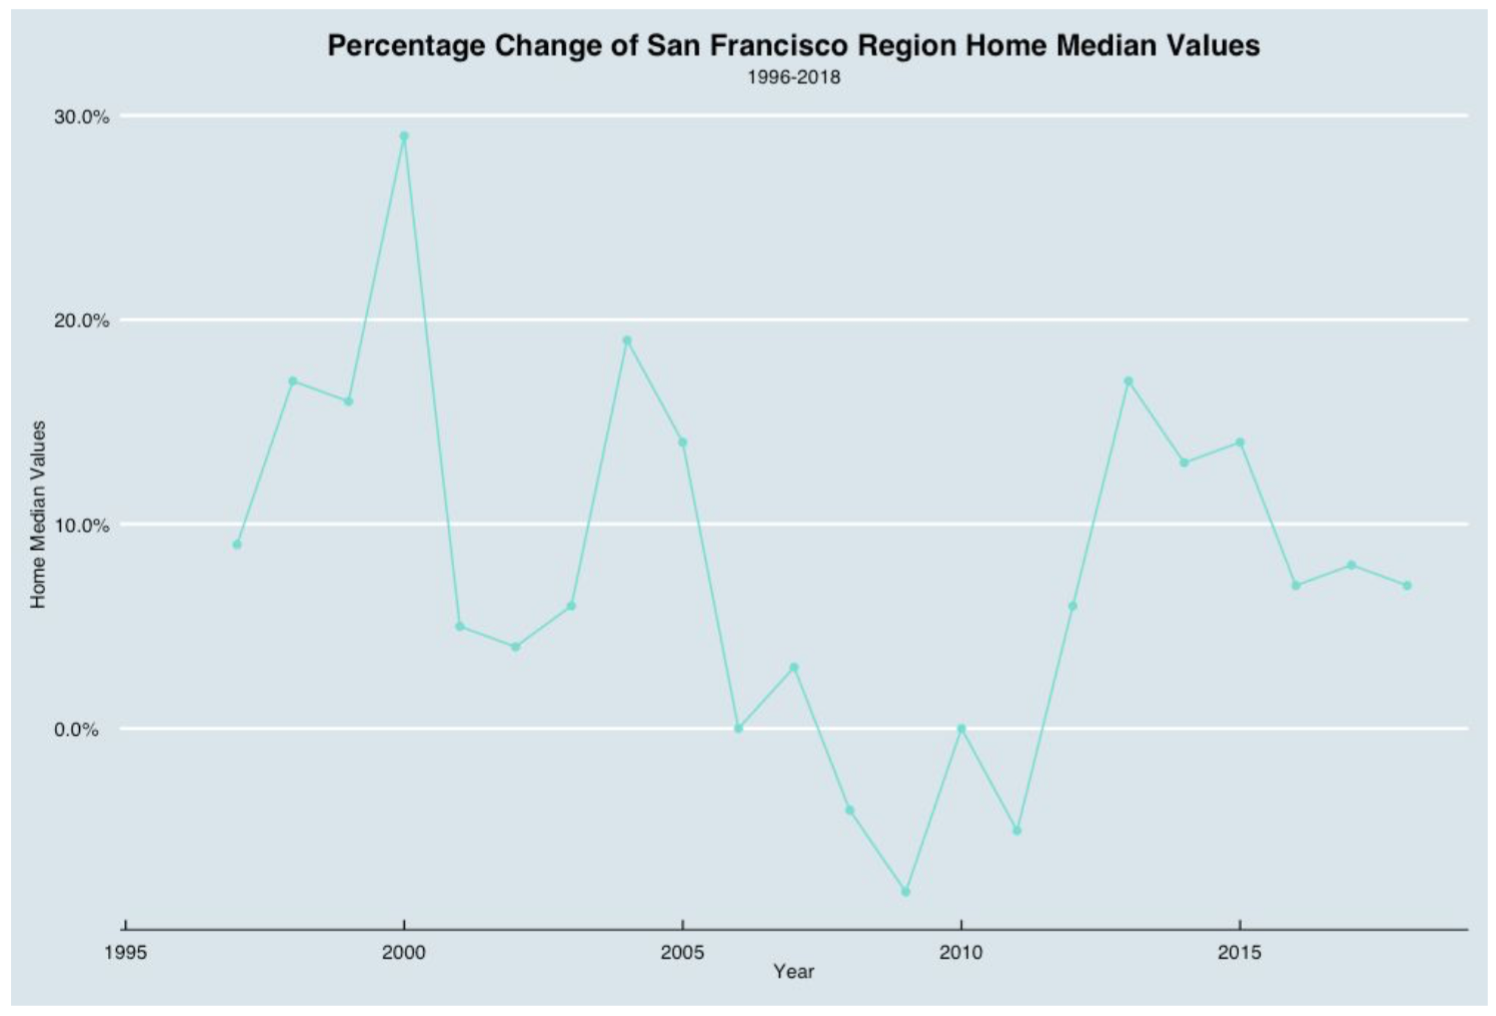
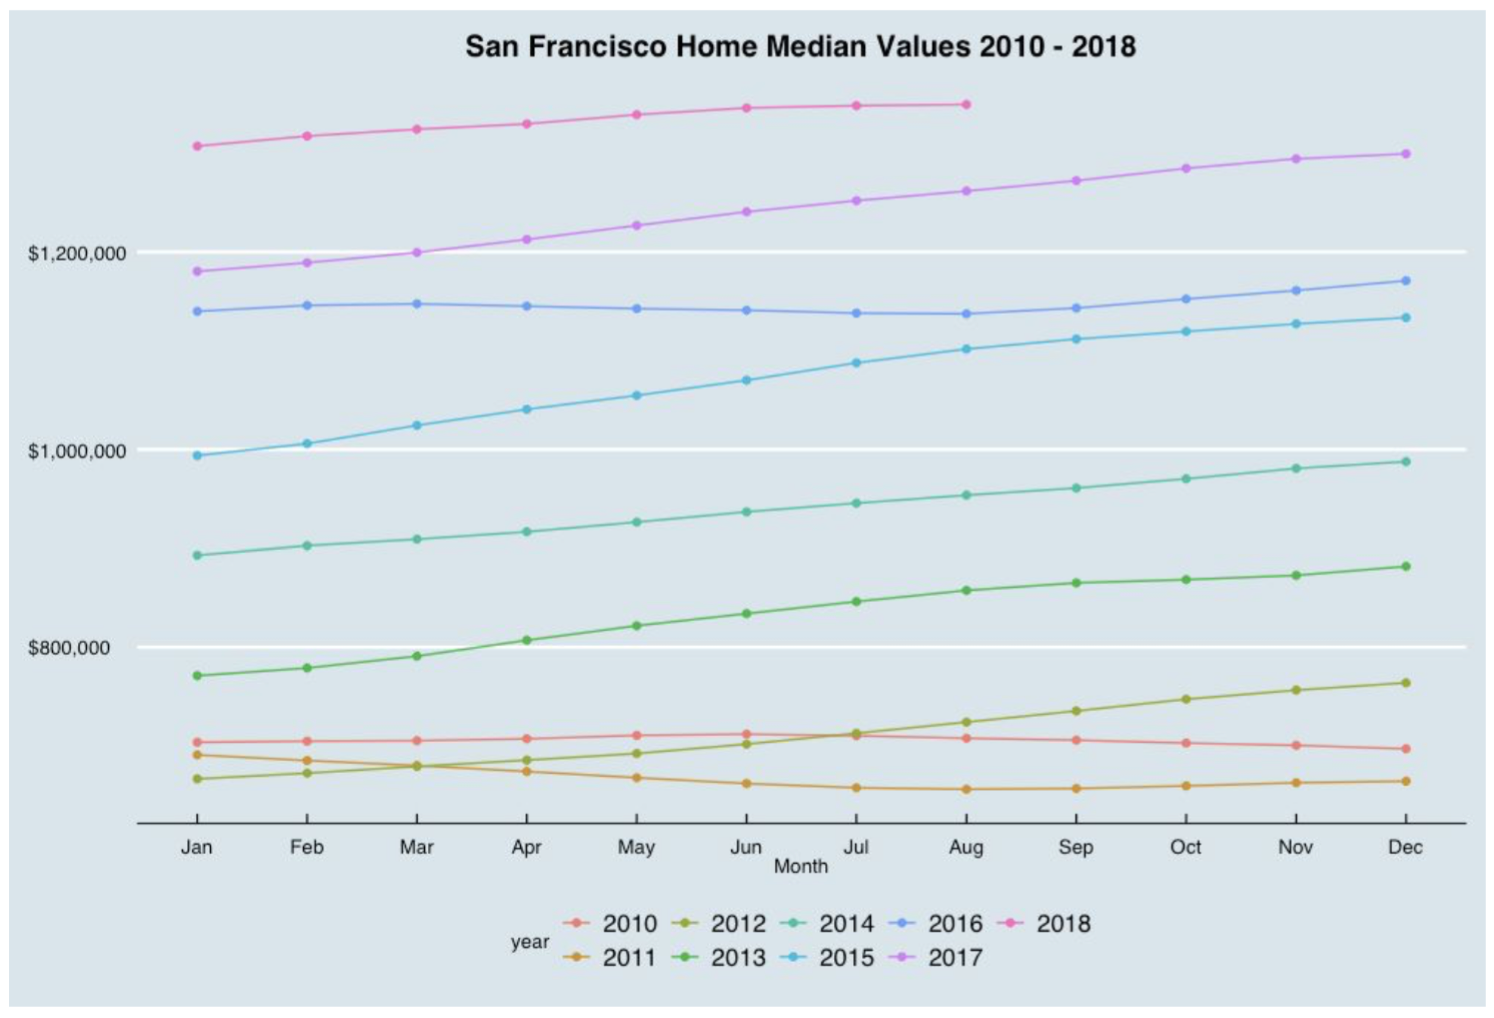
We can see percentage change are positive, the highest percentage change occured in 2000 while the lowest percentage change occured in 2009 (Figure 2). Also, there is no seasonal component as described. We can see an increasing trend on going through the years of 2013 to 2018 (Figure 3).
Between 2001 and 2008, San Francisco region underwent two major economic crisis event:
- The Dotcom Bubble, March 11, 2000 to October 9, 2002
- The Housing Bubble ( The bubble didn’t actually burst until late 2007) In order to better understand the impact of those two events on the home Median Values in the San Francisco region, we evaluated those two major crisis by developing an Autoregressive Model (AR) and a multiple regression model
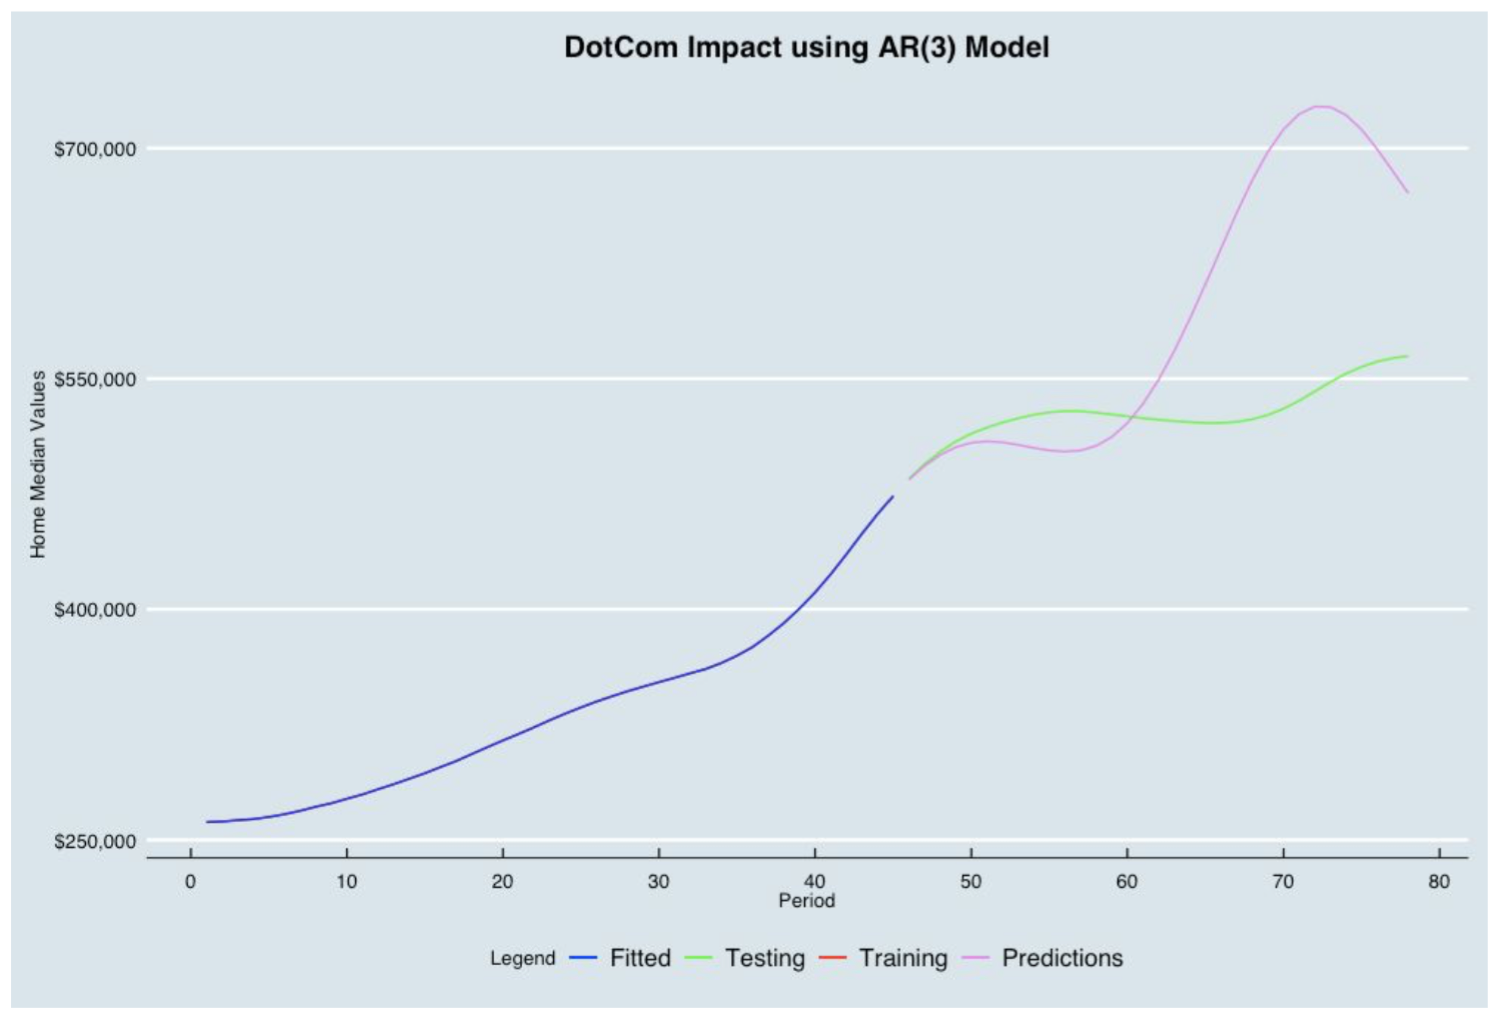
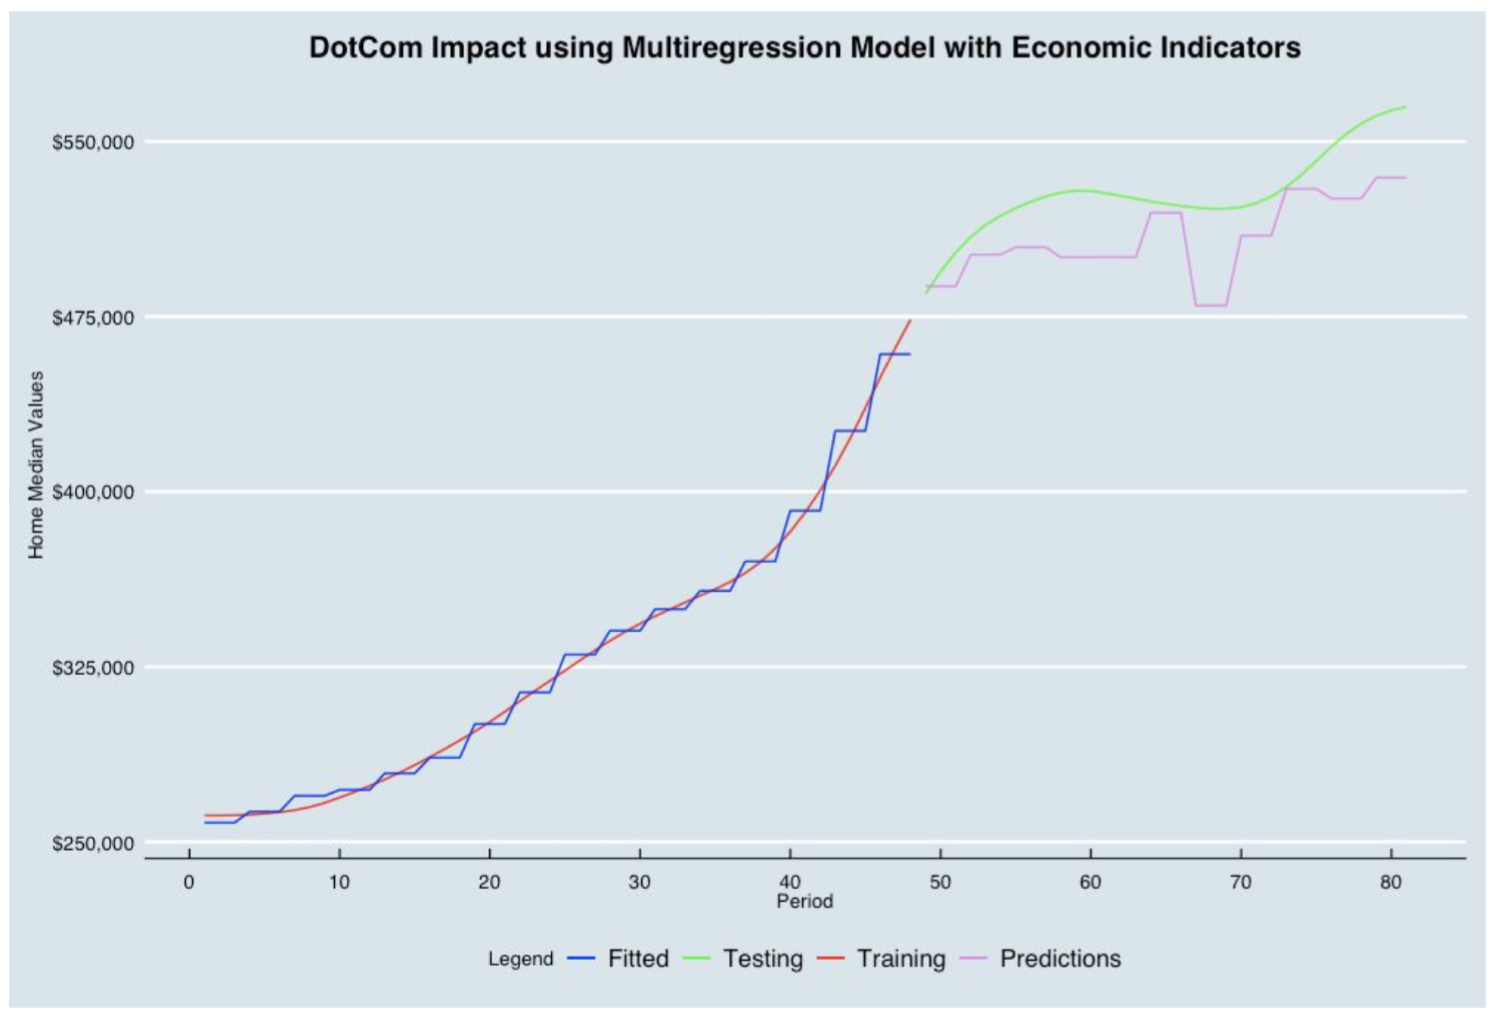
2. Dotcom Bubble
The Dotcom Bubble, also known as the tech bubble or the Dotcom boom, was a historic economic crisis in which people believed to be caused by a significant increase in internet-based companies, making the stock price on the internet sector rise rapidly.
Using an AR(3), the cumulative and quantitative impact of Dotcom Bubble burst affected the San Francisco region Housing Median Values by a loss of $2,044,028.04. While using a Multiple regression model with all the economic indicators given from the dataset, the cumulative and quantitative impact of the Dotcom Bubble burst affected the San Francisco region Housing Median Values by a gain of $641,566.78.
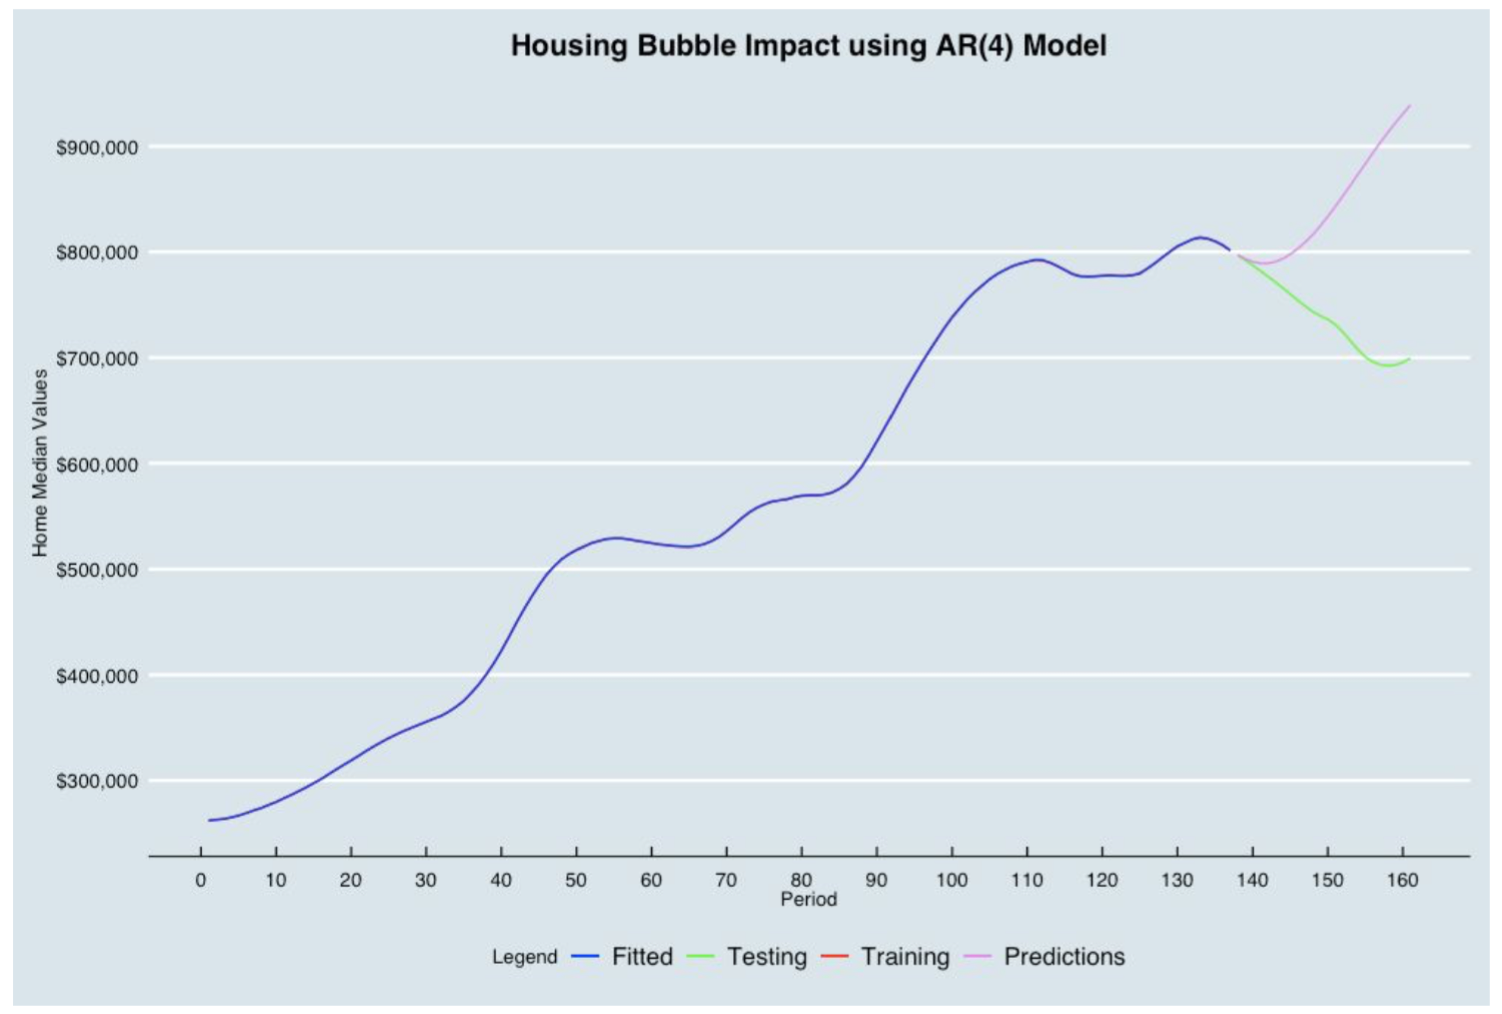
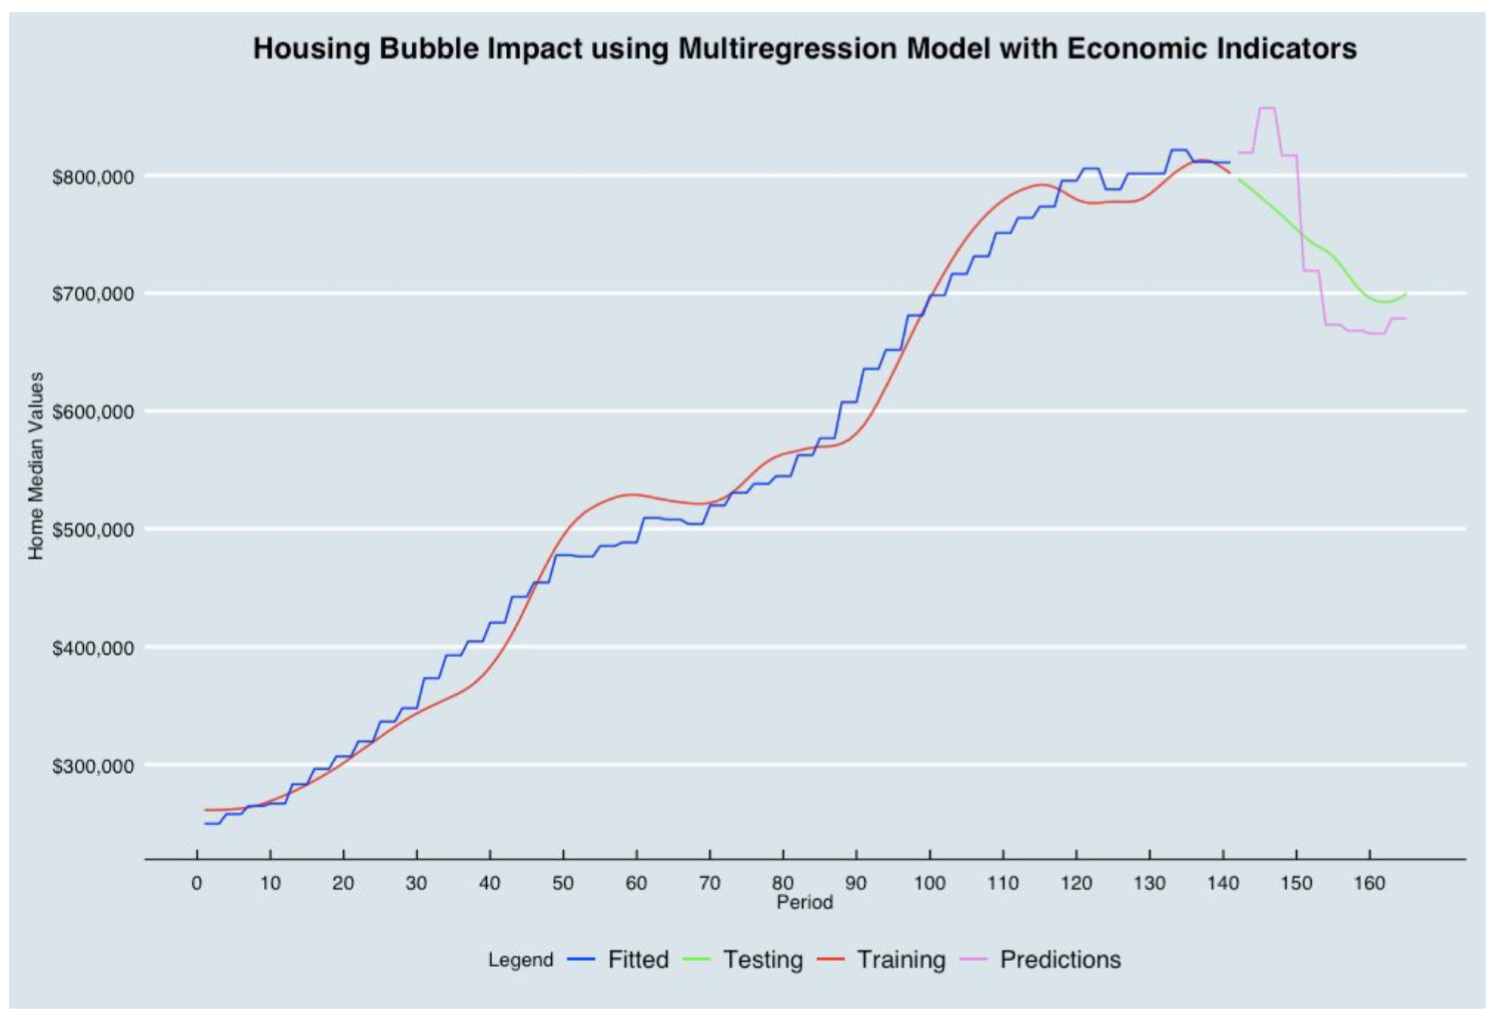
3. Housing Bubble
The Housing Bubble was an economic and real estate crisis causing by high demand and speculation in housing prices. The famous Housing Bubble started in the mid 2000s which was directly related with the financial crisis of 2007-2008.
Using an AR(4), the cumulative and quantitative impact of the Housing Bubble burst affected the San Francisco region Housing Median Values by a loss of $2,542,858.23. Using a Multiple regression model with all the economic indicators given from the dataset, the cumulative and quantitative impact of the Housing Bubble burst affected the San Francisco region Housing Median Values by a gain of $9,876.49.
As a result, the two major economic crises had varying impacts on San Francisco region median home values:
- Based on the AR models, San Francisco region was impacted by a significant loss in the home median values after the Dotcom Bubble burst and the Housing Bubble burst.
- Based on the Multiple Regression models, San Francisco region was impacted by a gain in the home median values after the Dotcom Bubble burst and the Housing Bubble burst.
Continued to Part 2